37th International ISOCARP Congress September 2001
Utrecht, The Netherlands
Author: Javier Alberto Martínez, MSc.
Abstract (lead)
Globalisation, privatisation and deregulation are usually seen as responsible for an increase in spatial segregation, social polarization and spatial inequalities. These problems can be described, analysed and monitored with Geographic Information Systems (GIS). The use of indicators and GIS has been applied in a case study in Rosario, Argentina.
Keywords: GIS, indicators, spatial inequality.
Javier Alberto Martínez, MSc.
Abstract
Globalisation, privatisation and deregulation are usually seen as responsible for an increase in spatial segregation, social polarization and spatial inequalities. These problems can be described, analysed and monitored with Geographic Information Systems (GIS). The combined use of geoinformation obtained from indicators and GIS analysis has been applied in a case study in Rosario, Argentina. This study is an example of how simple GIS applications can identify and describe spatial inequalities. Rosario has different levels of housing quality and access to physical and social infrastructure. Indicators were used to measure different levels of housing needs and provision of basic services. Spatial inequity related to access to social infrastructure was calculated for the most disadvantaged groups. Expressed demand was also calculated and compared with the demand derived from the indicators. The combined use of derived demand with expressed demand proved to be efficient in detecting cases of housing needs where derived demand via indicators was showing lower levels of demand or no demand at all. According to the evaluation it can be concluded that the city of Rosario is facing spatial inequalities. The result of this kind of studies can then be applied to target the most disadvantaged areas and to implement effective remedy policies.
Economic transformation is taking place around the world and globalisation, privatisation and deregulation are seen as responsible for an increase in spatial segregation, social polarization and spatial inequalities (Castells, 1996; Harvey, 2000). Social polarisation and the deterioration of the built environment have given birth to phenomenon of so called dual cities or divided cities (Mega, 1995). This phenomenon is the spatial polarisation of the city. Spatial polarisation and geographic inequity occur in urban areas around the world. However, especially in cities in developing countries inequalities are particularly evident. Inadequate habitat conditions, degradation of urban services infrastructure, unequal access to physical and social infrastructure, crime and unemployment are found in those cities. What all these problems have in common is a spatial dimension, since they all occur in specific areas of the city.
The spatial dimension of social polarization and inequalities makes them suitable for analysis and monitoring with the use of Geographic Information Systems (GIS). Even though there is an increasing number of experiences in the use of GIS and indicators for urban planning, there is much more need to emphasize on inequality issues rather than poverty issues. Confirming this need, the UNCHS (1995, pg 36) clearly presents spatial inequality as one of the areas for more fundamental research and it is specially stressed in the latest Report on Human Settlements “Cities in a Globalizing World” (UNCHS, 2001)
Descriptive studies, using GIS and indicators, can be applied to target the most disadvantaged areas and to implement effective remedy policies. Descriptive and comparative studies among different areas of the city can also raise awareness of the low quality of life of the urban poor and reveal the existence of dual/divided cities. The combined use of geoinformation obtained from indicators and GIS analysis has been applied to evaluate housing needs and inequalities in a case study in Rosario, Argentina.
Rosario, the second largest city in Argentina, is located in the South of the province of Santa Fe, along the shores of the Paraná River and it is approximately 300 km north-west of Buenos Aires. Almost one million inhabitants live in an area of nearly 180 km2. Rosario has different levels of housing qualities and access to services (infrastructure and social services) within its area. Due to urban and rural migration (caused mainly by the deterioration of regional economies), the number of illegal settlements in impoverished areas continues to grow. In 1996, The Municipal Bank Foundation (Fundación Banco Municipal, 1996) surveyed 91 slum settlements (“villas de emergencia”) inhabited by a total of 22,685 families (113,382 inhabitants, 11% of the total population of Rosario).
The main objective of this case study was to determine a methodology for evaluating the quality of life, conditions and needs of housing areas. Other objectives were: to evaluate spatial inequality in terms of housing adequacy, access to physical and social infrastructure, and provision of services; to determine the location and the characteristics of the most vulnerable groups affected by the lack of adequate housing.
The Southern District of Rosario (“Distrito Sur”) was chosen as the study area due to the lack of well-serviced areas, such as in the fields of health and education. It also has one of the highest concentrations of population in slums. According to the Census of 1991, the population of the district was 160,771 (the total population of Rosario was 894,645). It occupies an area of 1,876 ha., 10.5% of the total area of the city. One of the characteristics of this district is that it can be considered fully developed with almost no empty sites. The dominant use in the district is residential with a high concentration of public housing projects. At the same time, in some areas this use is mixed with productive activities and commerce.
According to Soja (2000) nowadays we can find much more “pluralistic axes of inequality formation: class, race, ethnicity, gender, sexuality, age, residential location, immigration status, housing, environmental justice, cultural identity, and so on”. This case study concentrates on the inequalities that are expressed in housing conditions, the housing needs that arise from that as well as the access to physical and social infrastructure. The resulting patterns of inequality express the extent to which people’s needs are satisfied and according to Smith (1994) it depends on how the social structure operates.
The evaluation of housing needs, was done measuring the derived or indirect demand of housing which can be obtained from indicators and was compared with the expressed demand which is the demand that is expressed by those seeking for adequate housing. The derived demand (or imputed demand) was analysed and calculated with the use of indicators. The selection of indicators was based on the criteria developed by the United Nations Commission for Human Settlements (HABITAT) for the Indicators Programme (UNCHS, 1995) . Some criteria for selecting indicators are:
· Importance for policy;
· Easily understood;
· Cost-effective;
· Includes most disadvantaged;
· Available for geographical areas or social groups.
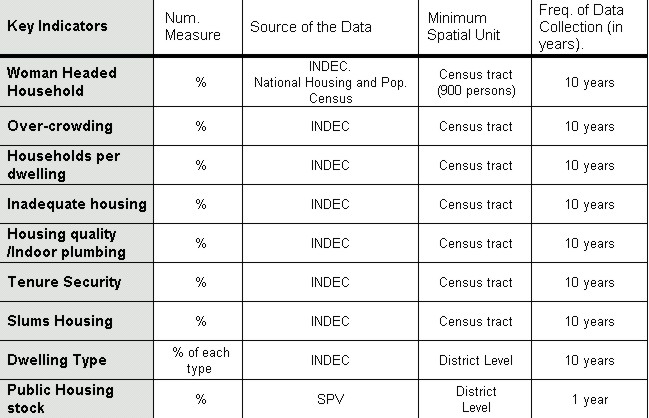
One of the most important criteria was the use of indicators from existing data sources. In this case, the main data source was the 1991 National Census of Population and Housing from the National Institute of Statistics and Censuses (INDEC). This census is produced each ten years and the data are presented as frequencies aggregated by “fraccion” and “radio censal”. The boundaries of each census tract ( “fraccion censal” ) are established so that the population in each is approximately of 13,500 people, regardless of its geographic size. INDEC divides each census tract into 15 smaller units called “radio censal” with a population of approximately 900 people. These “radios censales” are built up from individual blocks but the data was not available to the public at that level of disaggregation.
Fig 1. List of selected indicators
The result of each of the selected indicators was mapped to survey the differences in housing adequacy and to compare the shelter conditions over space. In all the cases the data was classified by the “natural breakpoints” method, as calculated by ArcView GIS.
In descriptive analysis, demand can be divided into derived demand and expressed demand (Webster, 1993). Derived demand of housing is evaluated indirectly by means of indicators. On the other hand expressed demand is evaluated directly by recording the expressions of demand by citizens. The number of registered demands for good housing is also a good indicator of the unsatisfied needs and may serve as an alternative indicator (Mega, 1995). To detect where the expressed demand was coming from, a point map was produced using tabular data created by the Social Work Department of the Public Housing Service of Rosario (SPV). The field selected was that of the address of the person that voluntarily went to the SPV office and asked for a housing solution or expressed his/her housing problem. “Geocoding” and “address matching” were the GIS process selected to map the expressed demand, where the address provides the locational key of the demand. The address matching capability of ArcView GIS can generate point locations that represent events on a map containing, like in this case, a street network ready for geocoding.
To analyse the relation between expressed demand versus derived demand (indicators) some GIS operations were performed. The location of the expressed demand was overlaid with a map of a combined indicator that included: inadequate housing, woman-headed households, overcrowding, indoor plumbing and ownership. All of them were given the same weight.
The indicators of housing adequacy and the expressed demand were complemented with the analysis of the access to social infrastructure, basically access to health services and kindergartens. To evaluate the accessibility problem in the southern district for the most vulnerable groups, two maps were produced: one regarding access to health centres and the other one to pre-school (e.g. kindergarten). In both cases an optimal walking distance of 750m was considered for mothers with pre-school children and for the elderly. To better assess this situation, the buffers were overlaid on a map with the percentage of women-headed households.
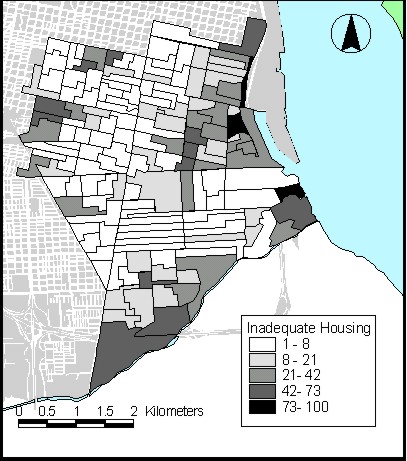
Fig. 2. Inadequate housing (Percentage of dwellings which are of inadequate types)
The percentage of the population living in these disadvantaged areas in relation to the district was 12.5%. In absolute values this represented at least 21,076 people living under high and very high housing needs conditions.
According to the study done by Fundación Banco Municipal (1996), 50% of the people living in slums were under 15 years old. For the total population in Rosario, the percentage was 25%. The following table (fig. 4) shows similar results, in this study all the census tracts with high or very high housing inadequacies had a percentage of children above the mean obtained for the district (25%).
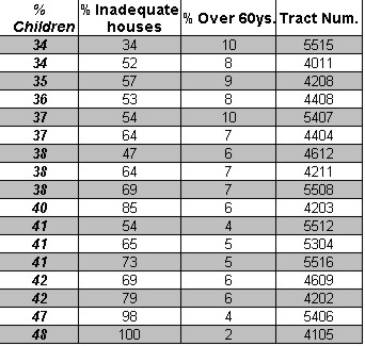
Fig. 4. Percentage of children in the most disadvantaged areas.
The following map (fig. 5) shows that almost no expressed demand was coming from the most disadvantaged areas (classified as high or very high level of housing needs). This might be partly explained if it is considered that people that registered at the Public Housing Office (SPV) were people that were already aware of the housing problem they face and wanted to improve their conditions. On the other hand, people living in the slum areas might have not considered the option of claiming for better conditions, either because they knew that sooner or later they would be included in an upgrading program or because they did not think they were able to improve their situation.
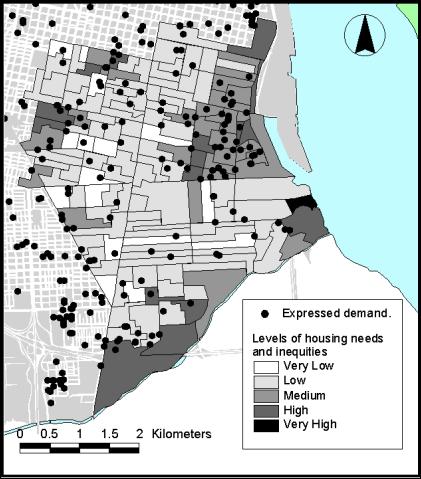
Fig. 5. Derived and expressed demand. (each dot represents the demand from one family).
Some clustering of expressed demand was visually detected in areas of medium and high levels of housing needs, specially in the tracts located in front of the harbour. The distribution of points of expressed demand on areas with different levels of housing needs and inequities was calculated. For doing so, a spatial join was performed in ArcView between the dot map and the derived demand map to find out in which area each point of expressed demand was located. Later, the dot map was summarised by the areas of housing needs to obtain the total number of expressed demand per areas of derived demand.
The result is shown in the following chart (fig. 6) where it can be seen that most of the demand in absolute values was coming from areas of low housing needs. Note that no demand was coming from areas classified as very high.
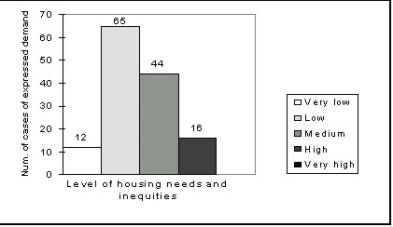
Fig. 6. Distribution of cases of expressed demand in absolute values, on areas with different levels of housing needs.
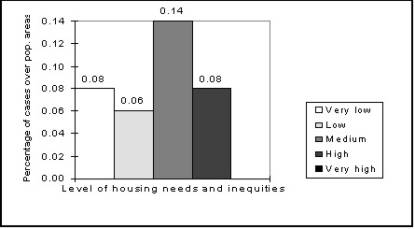
Fig. 7. Distribution of cases of expressed demand over total population of areas with different levels of housing needs.
The distribution of cases of expressed demand was also calculated as a ratio to the population of the areas with different levels of housing needs. In this case (fig. 7) most of the demand in relative values was coming from areas with a medium level of housing needs.
The combined use of derived demand with expressed demand proved to be efficient to detect cases of housing needs where derived demand via indicators showed lower levels of housing needs or hid the situation. This can help in the detection of the “new poor” normally hidden by many indicators. This new poverty is scattered throughout the cities and since they are not living in recognisable poor neighbourhoods they can be found in any middle-class apartment block (Minujin 1995).
In Rosario, large sectors of the population are still without private transport. In 1993 62% of the families in Rosario did not have a car (UIM, 1997). In cases like this, the actual distance from home to basic education, health facilities and especially the family doctor’s surgery is particular critical. About 750 meters is often regarded as the upper limit for mothers with pre-school children and for the elderly; and travelling much more than this by public transport may involve a long wait or a change of bus (Knox, 1982). Sometimes the situation for the elderly is even worse, the optimal distance can be defined as a walking distance of 250 meters for the less-mobile elderly and 500 meters for the mobile elderly (Grothe et als. 1992)
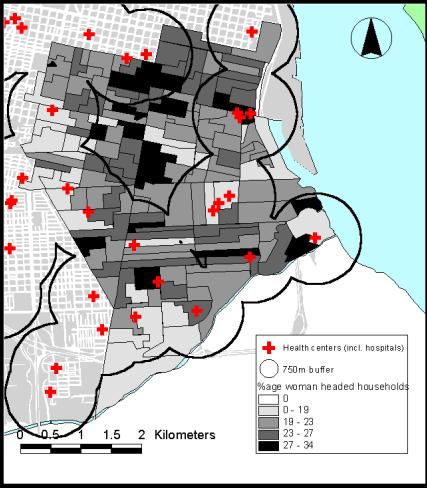
Fig. 8. Accessibility to health centres.
The maps showed that large housing areas had a disadvantaged location in relation to the access to the most relevant social infrastructure like health and pre-school facilities. This situation is even worse for those areas where the highest percentage of the households was women-headed, like in the middle part of the district (fig. 8).
For the most of the indicators, four areas consisting of groups of census tracts were identified as having the highest levels of housing needs and inequities (classified as medium, high and very high). Two areas were located in front of the harbour, the third one on the southern limit and the other on the western limit of the district. In these areas the main results were:
· Overcrowding levels from 31% to 63%.
· Inadequate housing from 21% to 100%.
· Low levels of indoor plumbing, with the worst situation found in the slums facing the harbour (0% to 8%).
· Low tenure security-ownership, 0% to 32%.
· All these figures were influenced by the high proportion of residential areas occupied by slums.
The level of access to social infrastructure was not equally distributed. Large housing areas have a disadvantaged location in relation to the access to the most relevant social infrastructure like health and pre-school facilities. This situation was even worse for those areas where the highest percentage of the households were women-headed, like in the middle part of the district. The indoor plumbing indicator showed that the access to physical infrastructure like water is not equally distributed along the district.
The HABITAT 1996 report recognised GIS as one of the tools that is now used as part of more effective urban planning approaches (UNCHS, 1996). In any planning office, there is a great reservoir of information that is costly to collect. GIS offers a tool to manage and present this information. The value of this information increases the more it is shared and disseminated (Huxhold, 1991). This case study is an example of the utility of integrating and using existing digital data like census information; and tables and GIS shape files already available at the Municipality in different offices.
Over the last decade, international economic competition has meant that whilst average national incomes have grown, the real wages or benefit levels of the poorest neighbourhoods have stagnated (Mega, 1996). Unemployment levels and poor access to information and training worsen the problem. According to the same author the spatial effects of social polarisation are so marked that they have given birth to the description of divided or dual cities. This phenomenon, also referred to as “geographical inequality”, is encountered in Rosario where often there is a reference to “a city inside another city”. The use of GIS and indicators to describe and compare different areas of the city can raise awareness of the low quality of life of the urban poor and reveal the existence of dual/divided cities. The result of this kind of studies can then be applied to target the most disadvantaged areas and to implement effective remedy policies.
References
Castells, M., 1996. The Information Age : Economy, Sociey and Culture : Vol. I The rise of the network society., 1. Blackwell, Oxford, 556 pp.
Fundación Banco Municipal, 1996. Asentamientos irregulares en Rosario 1996. Fundación Banco Municipal, Rosario.
Grothe, M. and Walter, B., 1992. GIS measures elderly housing and neighbourhoods. GIS Europe September 1992 pp. 20-24, The Netherlands
Harvey, D., 2000. Spaces of hope. Edinburgh University Press, Edinburgh, X, 293 pp.
Huxhold, W. E., 1991. An introduction to Urban Geographic Information Systems. Oxford University Press, New York.
Knox, P. ,1982. Urban Social Geography. Longman Group, London.
Mega V. ,1995. Sustainability indicators for European cities. In: Indicators for Urban Policies. Rennes, France.
Mega, V., 1996. Our city, our future: towards sustainable development in European cities. Environment and Urbanization, Vol. 8, No.1, pp. 133-154.
Minujin, A.,1995. Squeezed: the middle-class in Latin America. Environment and Urbanization, Vol. 7, No.2, pp. 153-165.
Smith, D.M., 1994. Geography and social justice. Oxford. Blackwell, XVI, 325 pp.
Soja, E.W., 2000. Postmetropolis : critical studies of cities and regions. Blackwell, Oxford, 440 pp.
UNCHS (United Nations Centre for Human Settlements), 1995. Indicators Programme, Volume 1, 2 and 3. UNCHS, Nairobi.
UNCHS (United Nations Centre for Human Settlements), 1996 An Urbanising World: Global Report on Human Settlements, 1996. Oxford University Press, New York.
UNCHS (United Nations Centre for Human Settlements), 2001. Cities in a Globalizing World. Global Report on Human Settlements 2001. Erthscan, London, 344 pp.
UIM - Unidad de Información Municipal,1997. Rosario, números de una ciudad en crecimiento. Edited by PER (Plan Estratégico Rosario), Rosario.
Webster, C J.,1993. GIS and the scientific inputs to urban planning. Environment and Planning B: Planning and Design, Vol. 20, pp. 709-728.
[1] It includes slums and unsuitable housing. Unsuitable housing is defined according to the National Census Bureau (INDEC) and includes: Camps, “Casas de inquilinato“, huts and shanties, rooms not built for habitat, motor homes and those dwellings which meet at least one of the following conditions: no provision of piped water inside the house, no flush toilet, floor of earth or other material which is not ceramic, tiles, mosaic, wood, carpet, plastic, cement, or fixed brick.
Note: This article was based on the research done between 1996 and 1998 in the International Institute for Aerospace Survey and Earth Sciences (ITC, Enschede). Part of that research was also published in Habitat International 24 (2000) 501-515.
Javier Alberto Martinez, MSc.
PhD. Student UU – ITC
E-mail address: jmartinez@itc.nl , jmtznet@netscape.net